


Chrome DevTools has moved a long way since this list first went up — Chrome itself has passed version 150, and DevTools has picked up serious AI tooling along the way. Updated for 2026: three of the original five features below are still genuinely worth knowing and got fresh screenshots straight from a current build of DevTools; the two that had gone stale were swapped for what's actually useful today.
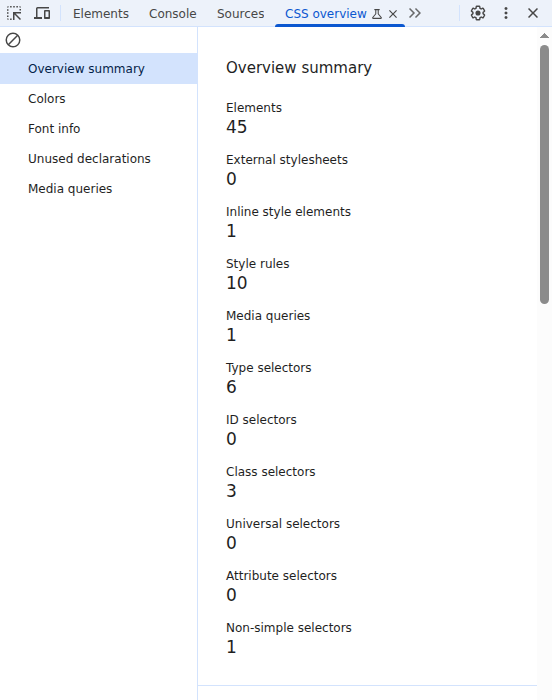
1. CSS Overview — every bit and piece of styles, at a glance
Open the Command Menu (Ctrl+Shift+P, or Cmd+Shift+P on Mac) and search "CSS overview" to get a full audit of a page's stylesheet: every color and font in use, how many unused declarations are sitting around, and where your media queries kick in. It's the fastest way to find out a page you didn't build is quietly shipping five different shades of "black."
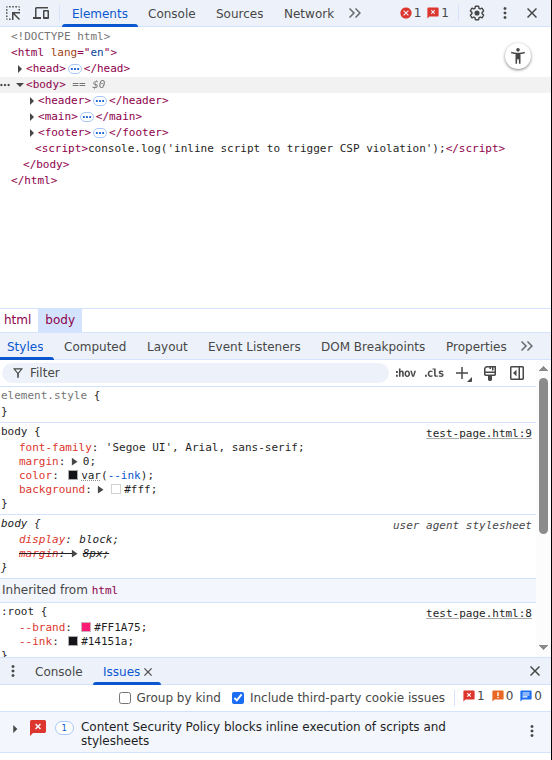
2. CSP violations — caught automatically in the Issues panel
If a page ships a Content-Security-Policy header, DevTools now surfaces every violation directly in the Issues tab instead of burying it in the console — including exactly which inline script or stylesheet got blocked and why. It's one of the fastest ways to catch a misconfigured CSP before a user does.
3. AI-powered debugging — Console Insights & AI Assistance
Since 2024, DevTools has shipped built-in AI features under Settings → AI innovations. Console Insights explains a confusing error or warning in plain English right where it happened. AI Assistance goes further, showing up inside the Styles, Network, Sources, and Performance panels to suggest fixes and explain what a piece of code — or a slow request — is actually doing. Both are opt-in and require being signed into Chrome, so if you've never turned them on, they're worth a look.
4. Chrome DevTools MCP — let your AI coding agent debug your browser
This is the newest and most useful addition since this article first went up. Chrome now ships an official DevTools MCP server, which lets AI coding agents drive a real Chrome instance — clicking through your app, reading console errors, capturing performance traces, even taking heap snapshots to chase a memory leak — instead of guessing purely from source code. Adding it to an MCP-compatible agent takes one line:
npx chrome-devtools-mcp@latestIf you're already coding alongside an AI assistant, this is what closes the loop between "the agent wrote the code" and "the agent can actually see it run."
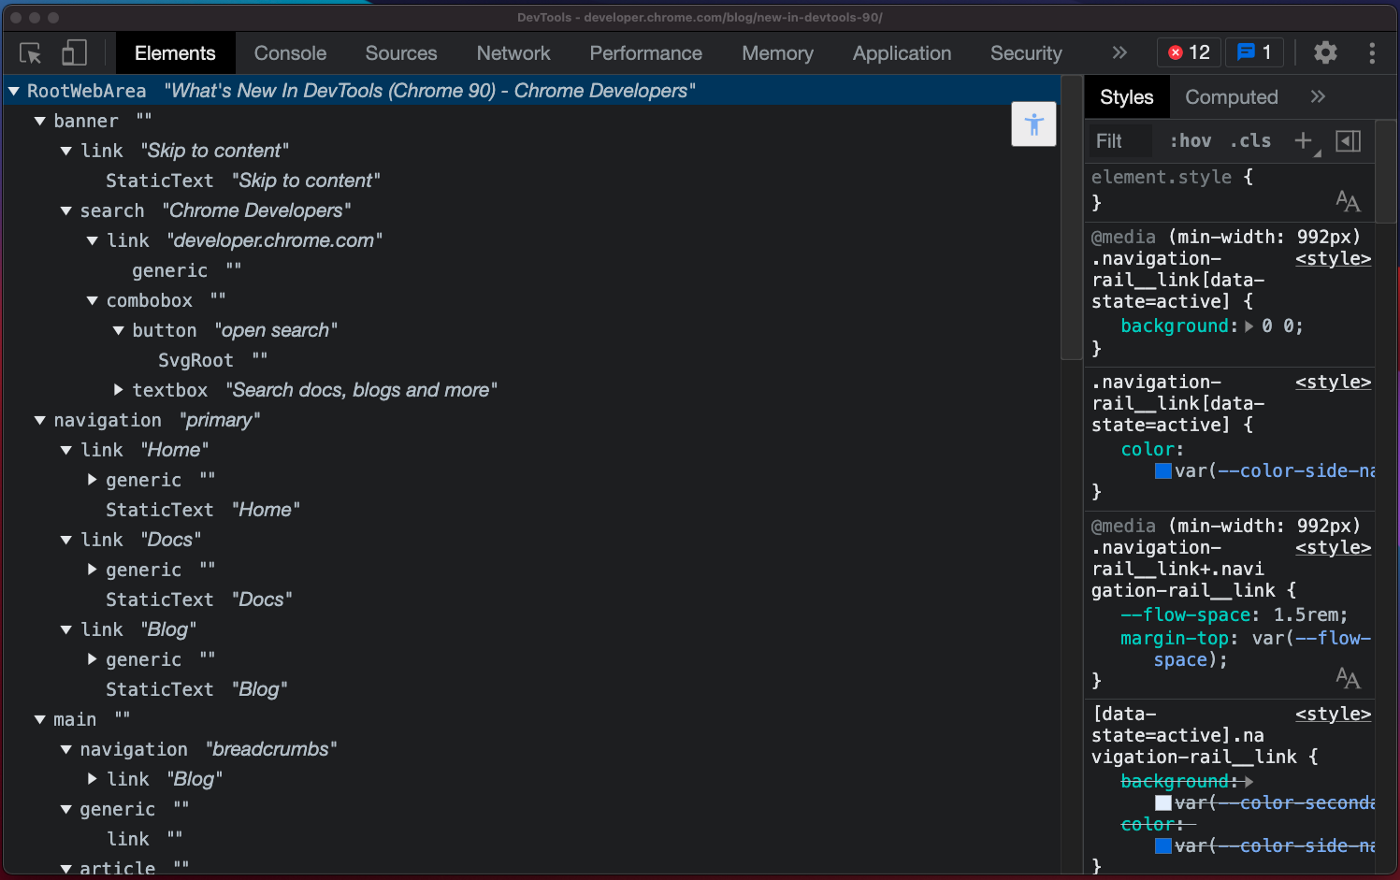
5. Full Accessibility Tree View — inspect elements the way a screen reader does
Still one of the most underused panels in DevTools. Click the accessibility icon in the top-right of the Elements panel to see the accessibility tree alongside the DOM tree — the actual name, role, and state a screen reader would announce for each element. It's a far faster way to catch accessibility bugs than eyeballing the markup.
Bonus: two more worth knowing
The Command Menu (Ctrl+Shift+P) is the fastest way to jump to any panel or setting without hunting through tabs — type what you want ("CSS overview," "Rendering," "Disable JavaScript") and hit enter.

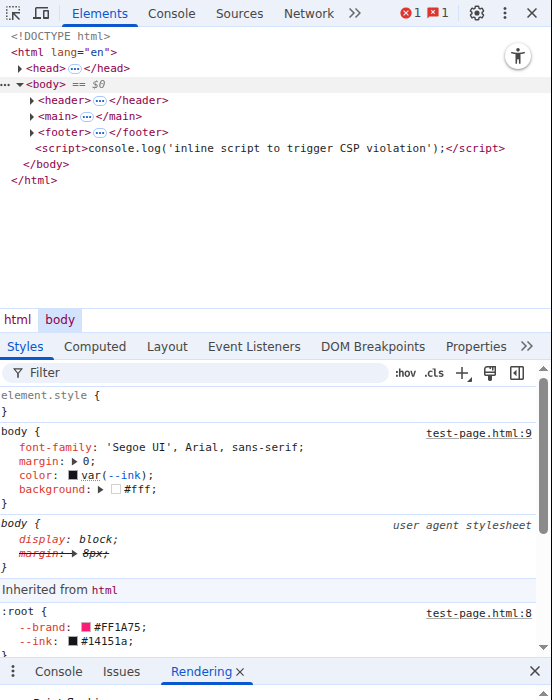
The Rendering panel (find it via the Command Menu) has toggles most developers never touch — Paint flashing highlights exactly what's being repainted, and Layout shift regions visualizes your Cumulative Layout Shift in real time, both far faster than digging through a Lighthouse report to find the same thing.
About the Author: I'm Yasas — a postdoctoral researcher, senior lecturer, and lead software engineer. I write about the developer tools I actually use day to day. More of my work, writing, and projects live at yasassri.me.


