

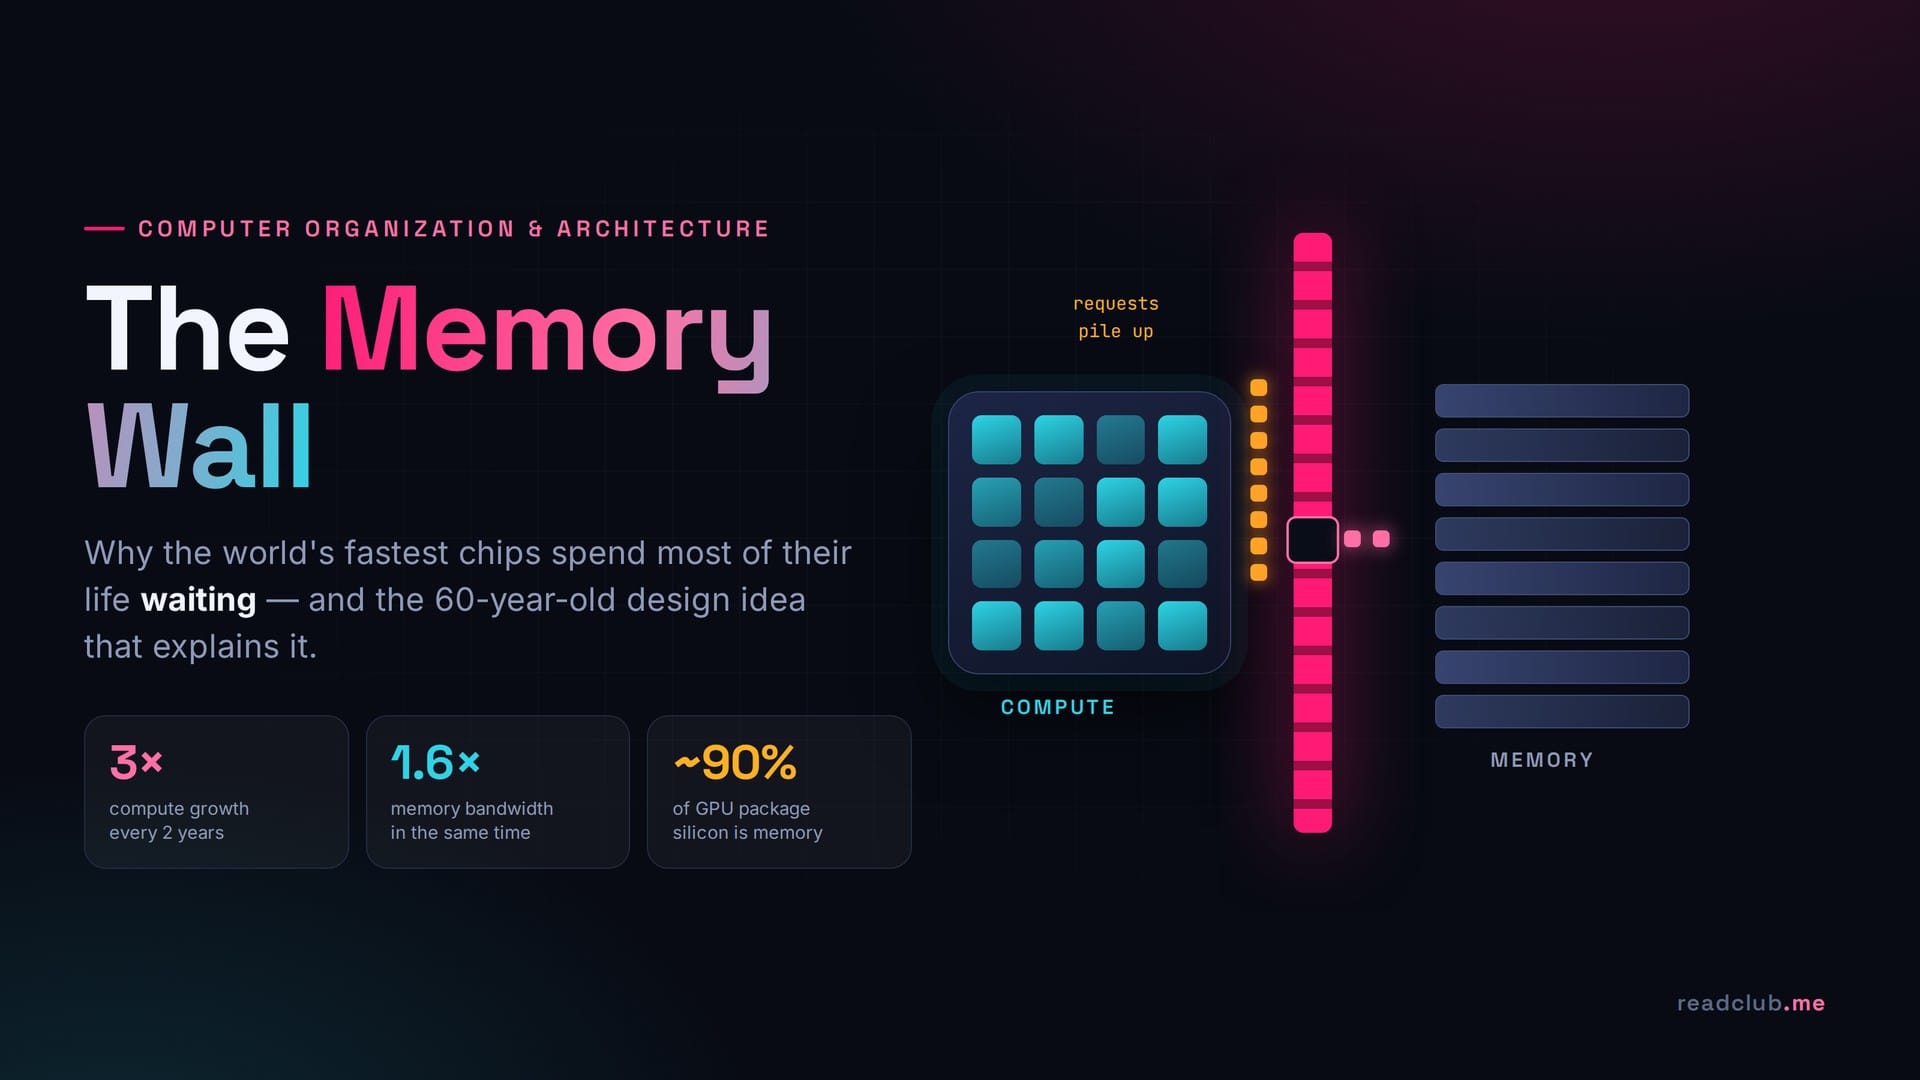
A modern AI accelerator can perform a few thousand trillion operations every second. For most of the work we actually give it, it spends the majority of its life doing nothing at all — waiting for numbers to arrive.
On 23 August 2026, at Hot Chips, a Micron design architecture fellow put up a slide that should be taught in every computer organization class. Compute on AI accelerators, he said, is scaling at roughly 3× every two years. The memory bandwidth feeding that compute is scaling at about 2×. The gap compounds. And in a typical GPU package built with four 12-high HBM stacks, something like 90% of the silicon in the package is memory, not compute.
Read that last number again. We are shipping chips that are mostly memory, and they are still starving.
This has a name — the memory wall — and it is not a 2026 problem. It is the oldest problem in computer organization and architecture, wearing a very expensive new suit. Everything in this article is a topic you would find in week three of an undergraduate COA course: the memory hierarchy, locality of reference, cache mapping, average memory access time, pipeline stalls. The syllabus did not become less relevant when AI arrived. It became the explanation.
Let's walk the whole chain, from the 1945 design decision that caused it to the roofline chart that a performance engineer will show you in 2026.
What the memory wall actually is
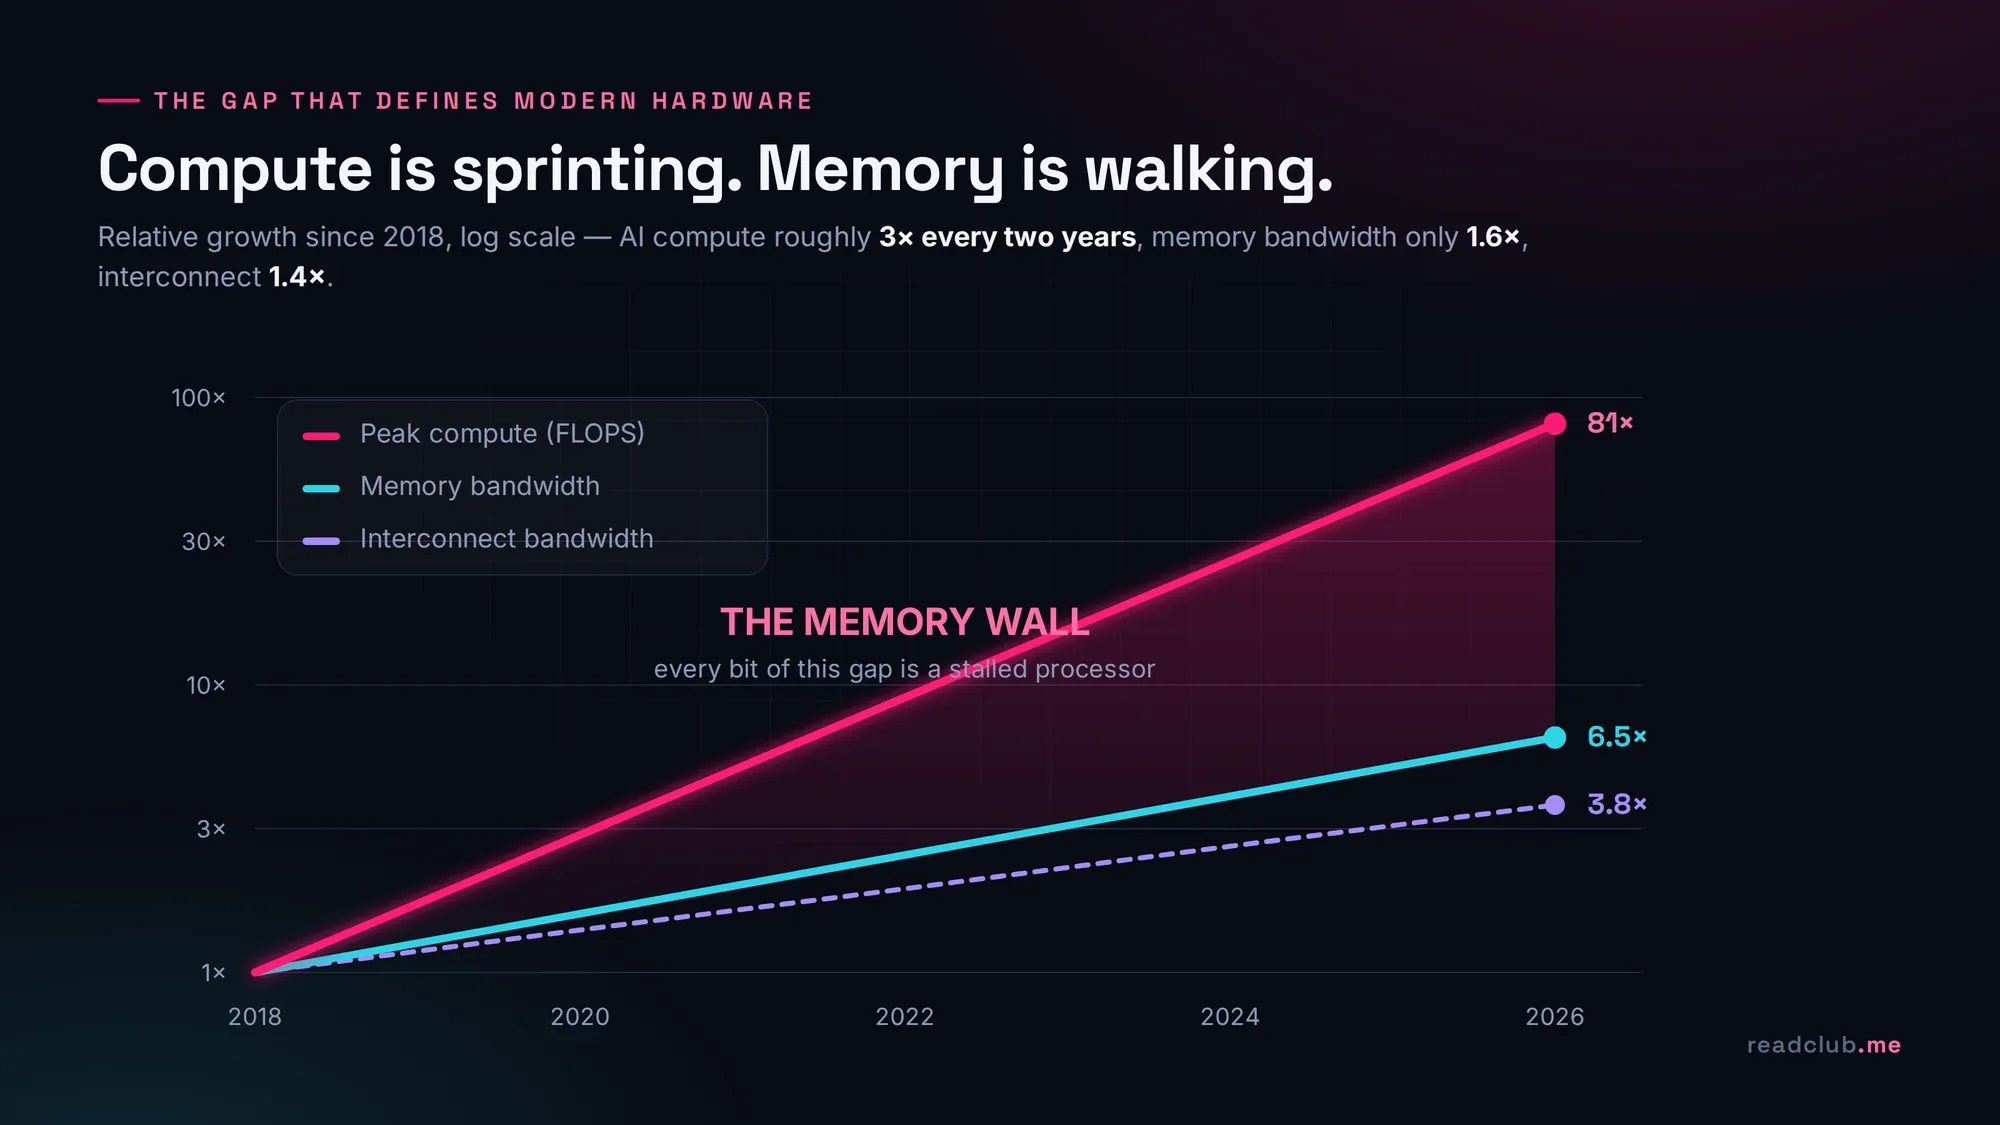
The term comes from a 1994 paper by Wulf and McKee, who noticed something uncomfortable: processor speed was improving at around 50% per year while DRAM latency improved at around 7%. Extrapolate two exponentials with different exponents and you do not get a gap. You get a cliff.
The modern version of the measurement, from the widely cited AI and Memory Wall analysis, is this: over a two-year window, peak compute in AI hardware grew about 3×, memory bandwidth about 1.6×, and interconnect bandwidth about 1.4×. Compound that over eight years and compute is up roughly 81× while the pipe feeding it is up about 6.5×.
The consequence is blunt, and it is the single most important sentence in this article:
Most computations today are limited by how fast data can be moved, not by how fast it can be processed.
Which means that if you want to reason about performance — in a data centre, in an embedded controller, or in an exam question — the interesting variable is almost never the ALU. It is the distance the data has to travel.
The 1945 decision that caused all of this
Von Neumann's stored-program model is the reason computers are general-purpose: put the instructions in the same memory as the data, and the machine can be reprogrammed without rewiring. It is arguably the most successful idea in the history of the field.
It also created a single shared road between the processor and memory, and that road has been the bottleneck ever since. Backus named it in his 1977 Turing Award lecture — the von Neumann bottleneck — and complained that the CPU spends most of its time shuffling data back and forth through a narrow tube rather than computing.
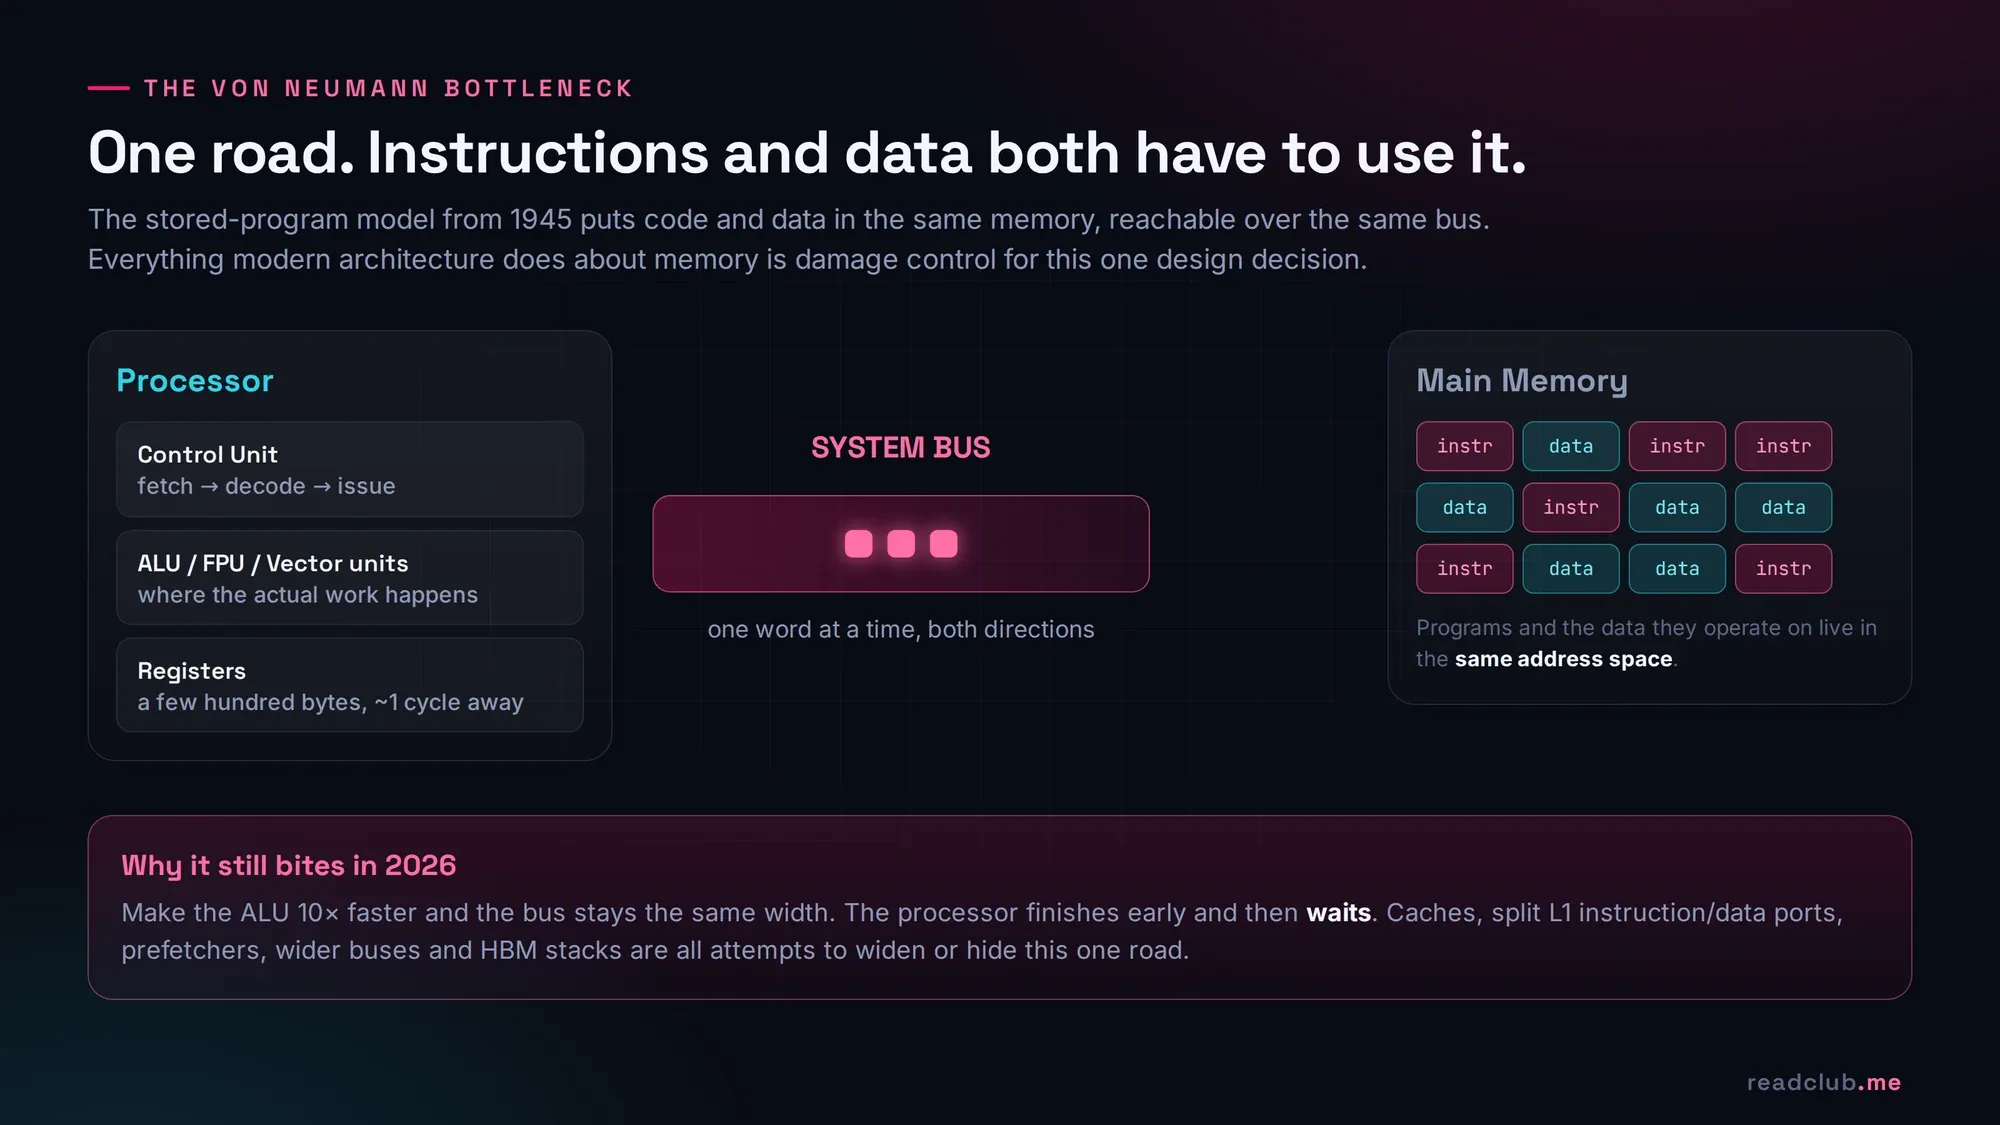
Here is the part students often miss. You can make the ALU ten times faster with a smaller process node. You cannot make the bus ten times wider without paying for pins, power and area that scale far worse. So every generation, the processor finishes its work sooner and then waits longer, in relative terms, than the generation before it.
Splitting the level-one cache into separate instruction and data ports — the Harvard-style trick every modern core uses internally — is a partial escape. Caches, prefetchers, wider buses and stacked HBM are all the same idea: you cannot remove the bottleneck, so you hide it.
The memory hierarchy is a ladder of cliffs
The textbook pyramid gets drawn so often that it stops meaning anything. So let's put real numbers on it, and then rescale those numbers into human time — taking one register access as one second.
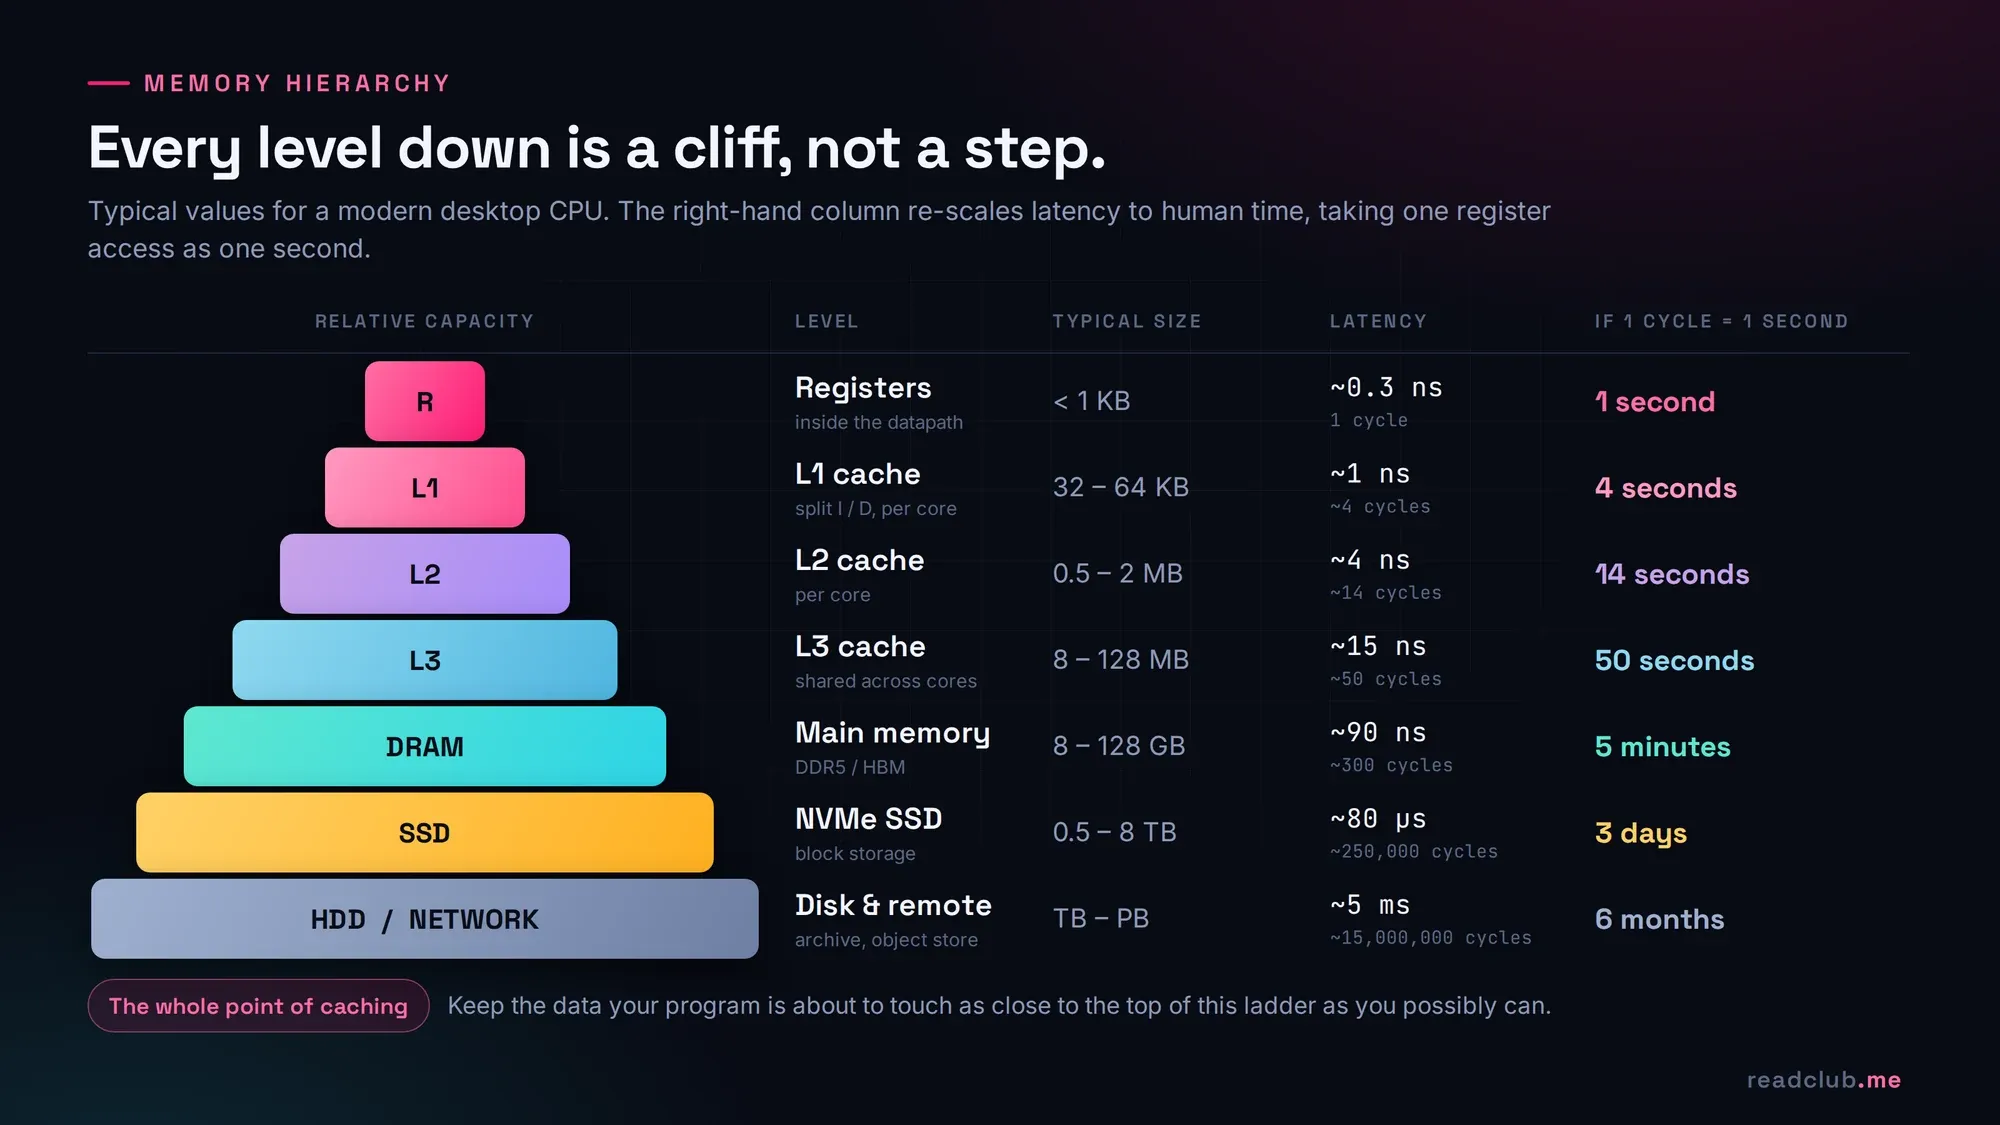
That right-hand column is the thing to internalise. On the human scale, an L1 hit is a four-second pause. A trip to DRAM is a five-minute coffee break. Touching an SSD is a three-day wait. Going to a spinning disk or over the network is six months.
No amount of instruction-level cleverness rescues a program that takes a six-month break in the middle. This is why the entire memory subsystem exists, and why "just add more cores" so often changes nothing: you added more people to the queue for the same narrow door.
Locality: the only reason any of this works
A cache is a bet. It bets that the data you touched a moment ago you will touch again soon (temporal locality), and that the data sitting next to it you will touch too (spatial locality). Real programs make that bet pay off, which is the only reason a few megabytes of SRAM can stand in for gigabytes of DRAM.
The clearest demonstration in the whole subject is four lines of C:
/* a[N][N] of floats, N = 4096  →  64 MB, far larger than any cache */

for (i = 0; i < N; i++)
    for (j = 0; j < N; j++)
        sum += a[i][j];        /* stride 4 B: one miss, then ~15 free hits */

for (j = 0; j < N; j++)
    for (i = 0; i < N; i++)
        sum += a[i][j];        /* stride 16 KB: a fresh cache line every single time */
Identical arithmetic. Identical instruction count. Identical compiler flags. On a typical desktop CPU the second loop commonly runs five to ten times slower — and on machines with a smaller last-level cache, worse than that. Nothing about the processor changed. Only the access pattern did.
If you have ever wondered why libraries like BLAS, or the kernels inside a deep learning framework, are written the way they are, this is the entire answer: they are organised around keeping data resident while it is still useful.
Cache mapping: where is a block allowed to live?
Once you accept that you need a cache, you face the design question that generates half of all COA exam questions. Memory is far bigger than the cache, so when a block arrives, which line does it go into?
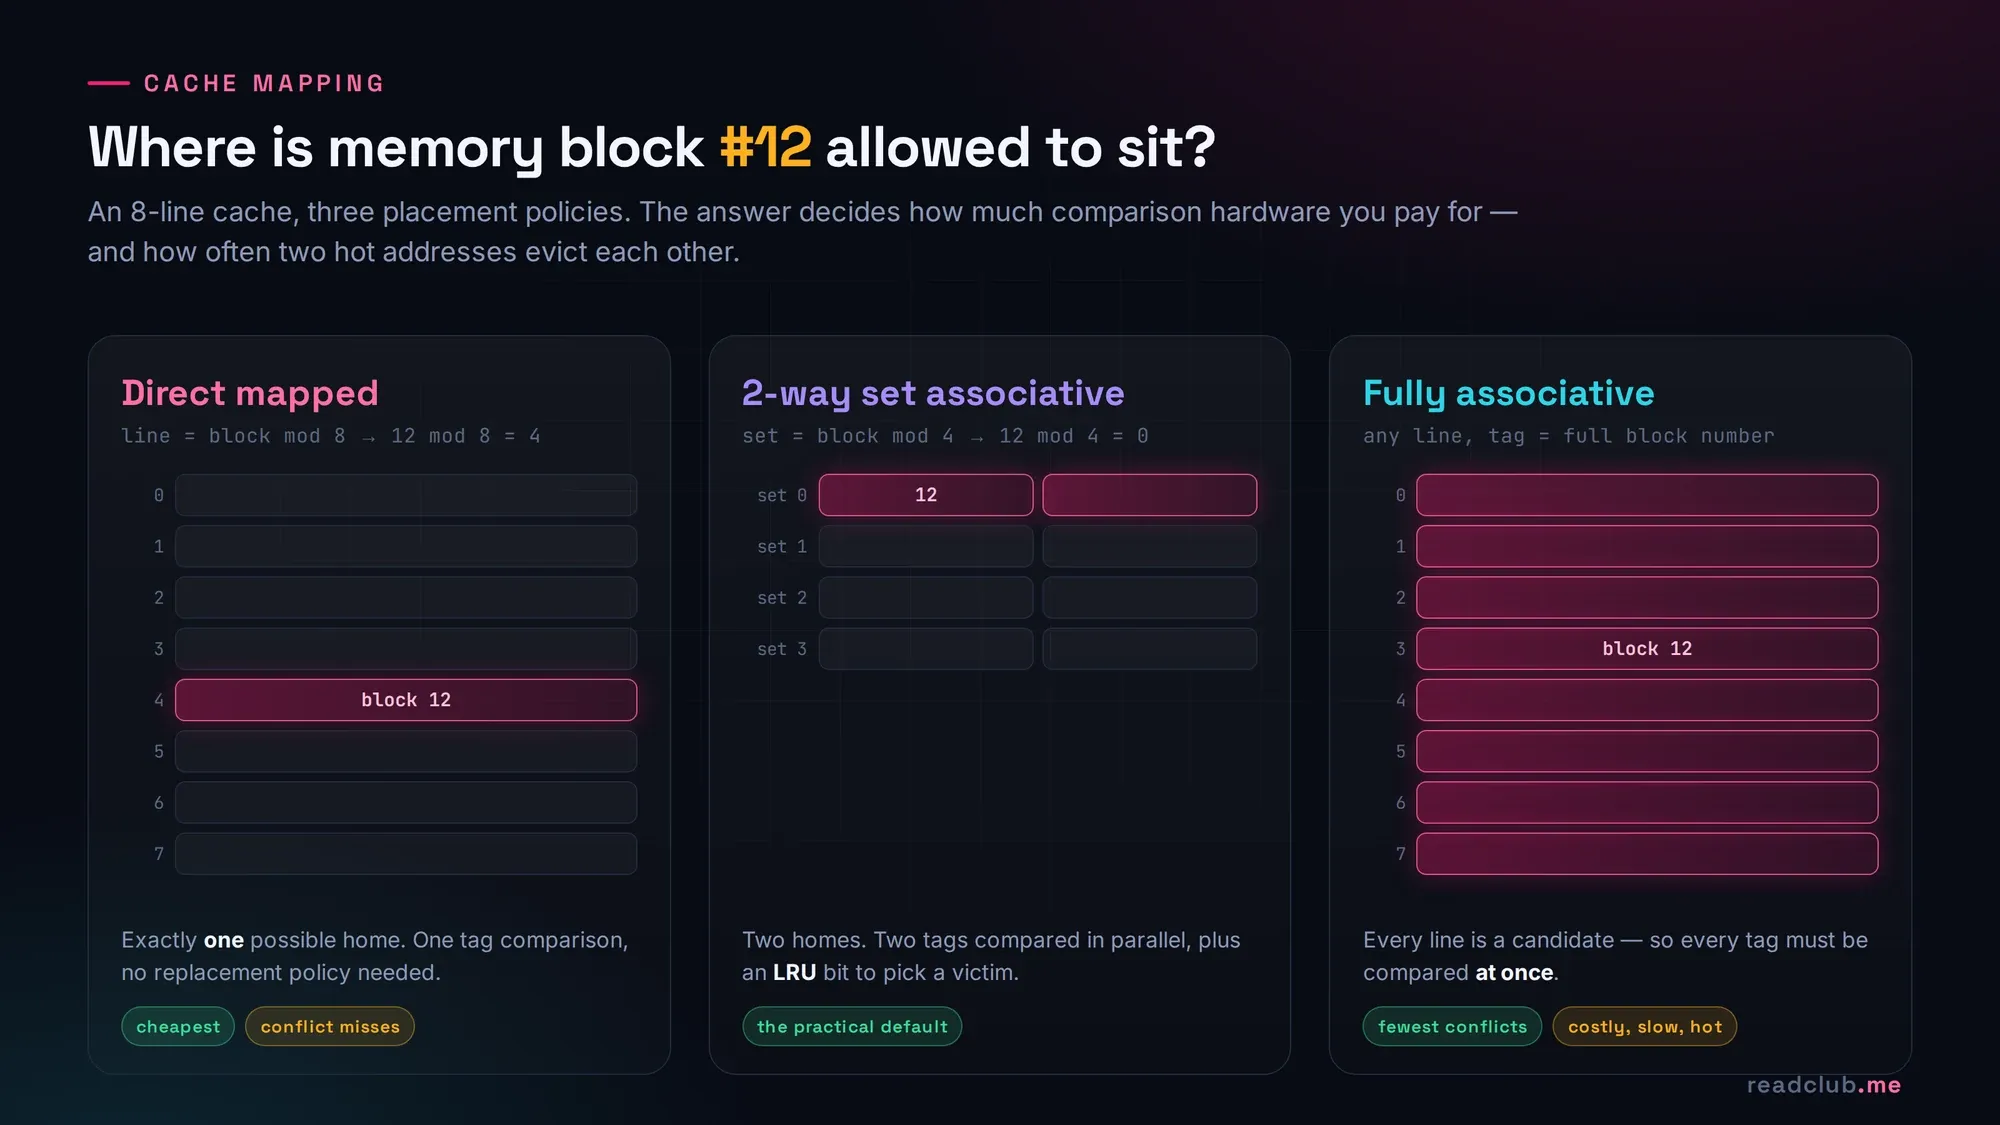
Three answers, three trade-offs:
- Direct mapped. Block number modulo the number of lines. One possible home, one tag comparison, no replacement policy at all. Cheapest and fastest per access — and it will happily let two hot addresses that map to the same line evict each other forever. Those are conflict misses, and they are why a matrix stride of exactly the wrong power of two can destroy your performance.
- Set associative. The block belongs to one set, but can occupy any way inside it. Two or eight tags compared in parallel, plus a replacement policy (usually an approximation of LRU) to choose a victim. Almost every real cache you will ever meet is set associative, because the first few ways buy most of the conflict-miss reduction for a modest hardware cost.
- Fully associative. Any line, any block. Minimum conflicts, maximum hardware: every tag must be compared simultaneously, which costs area, power and access time. In practice it is reserved for small structures like TLBs.
Note what associativity does not fix: compulsory misses (the first touch of anything) and capacity misses (your working set simply does not fit). The classic "three Cs" model — compulsory, capacity, conflict — is worth memorising precisely because it tells you which lever to pull. Only conflict misses respond to associativity. Capacity misses respond to blocking and tiling. Compulsory misses respond to prefetching.
How a cache reads an address
A cache never sees your address as a single number. It slices it into three fields, and the widths of those fields fall straight out of the cache geometry.
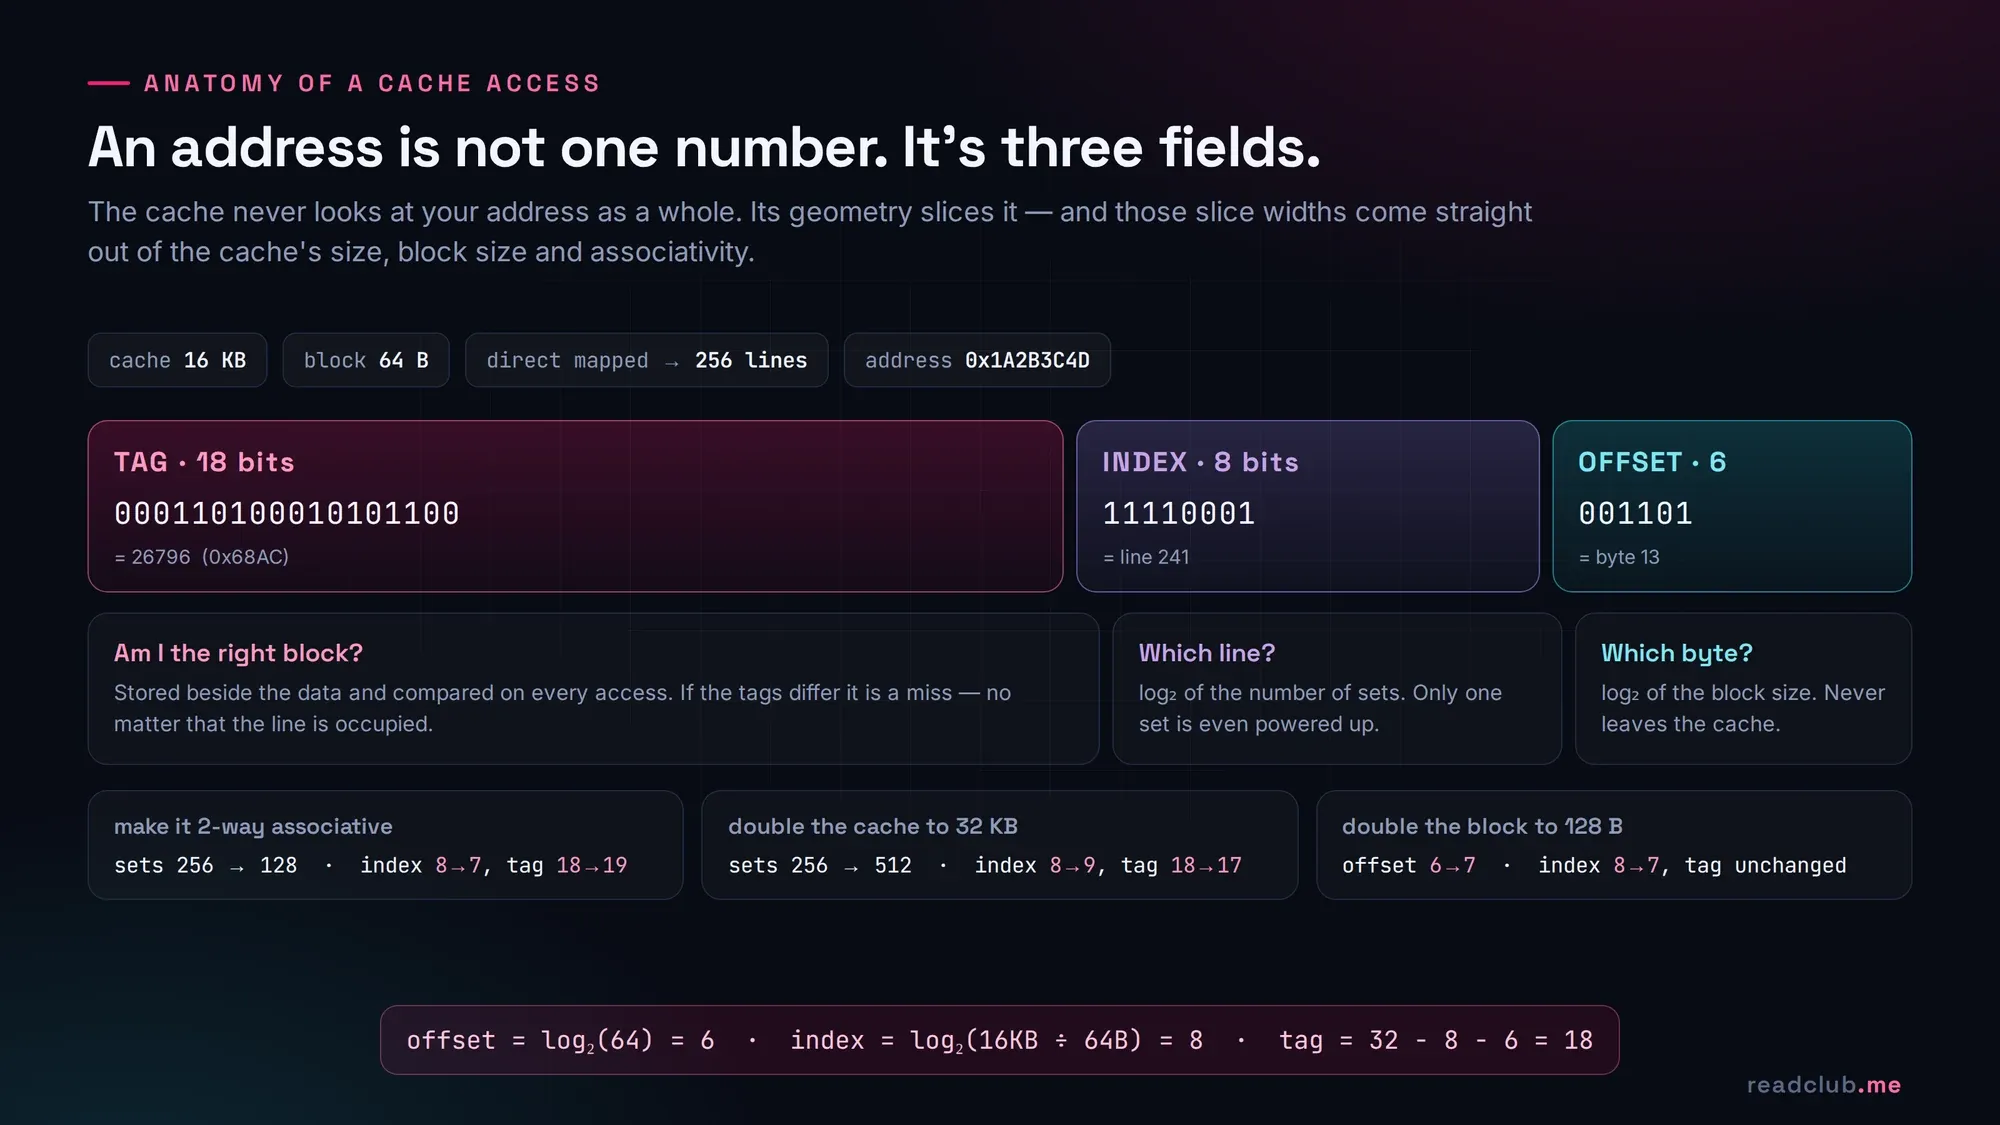
The recipe never changes:
- offset = log₂(block size in bytes)
- index = log₂(number of sets) — and number of sets = cache size ÷ (block size × associativity)
- tag = address width − index − offset
Do it once slowly, by hand, with a real hex address, and the whole topic stops being intimidating. Do it fifty times and you will start reading cache specifications the way a musician reads a chord chart. This calculation, and its variants for set-associative caches and multi-level hierarchies, is the highest-yield thing in the entire memory chapter — it appears in some form in almost every university paper and competitive exam I have seen.
AMAT: the number that actually decides performance
Hit rate is the statistic everyone quotes and almost nobody feels. Average memory access time is where it becomes real:
AMAT = hit time + (miss rate × miss penalty)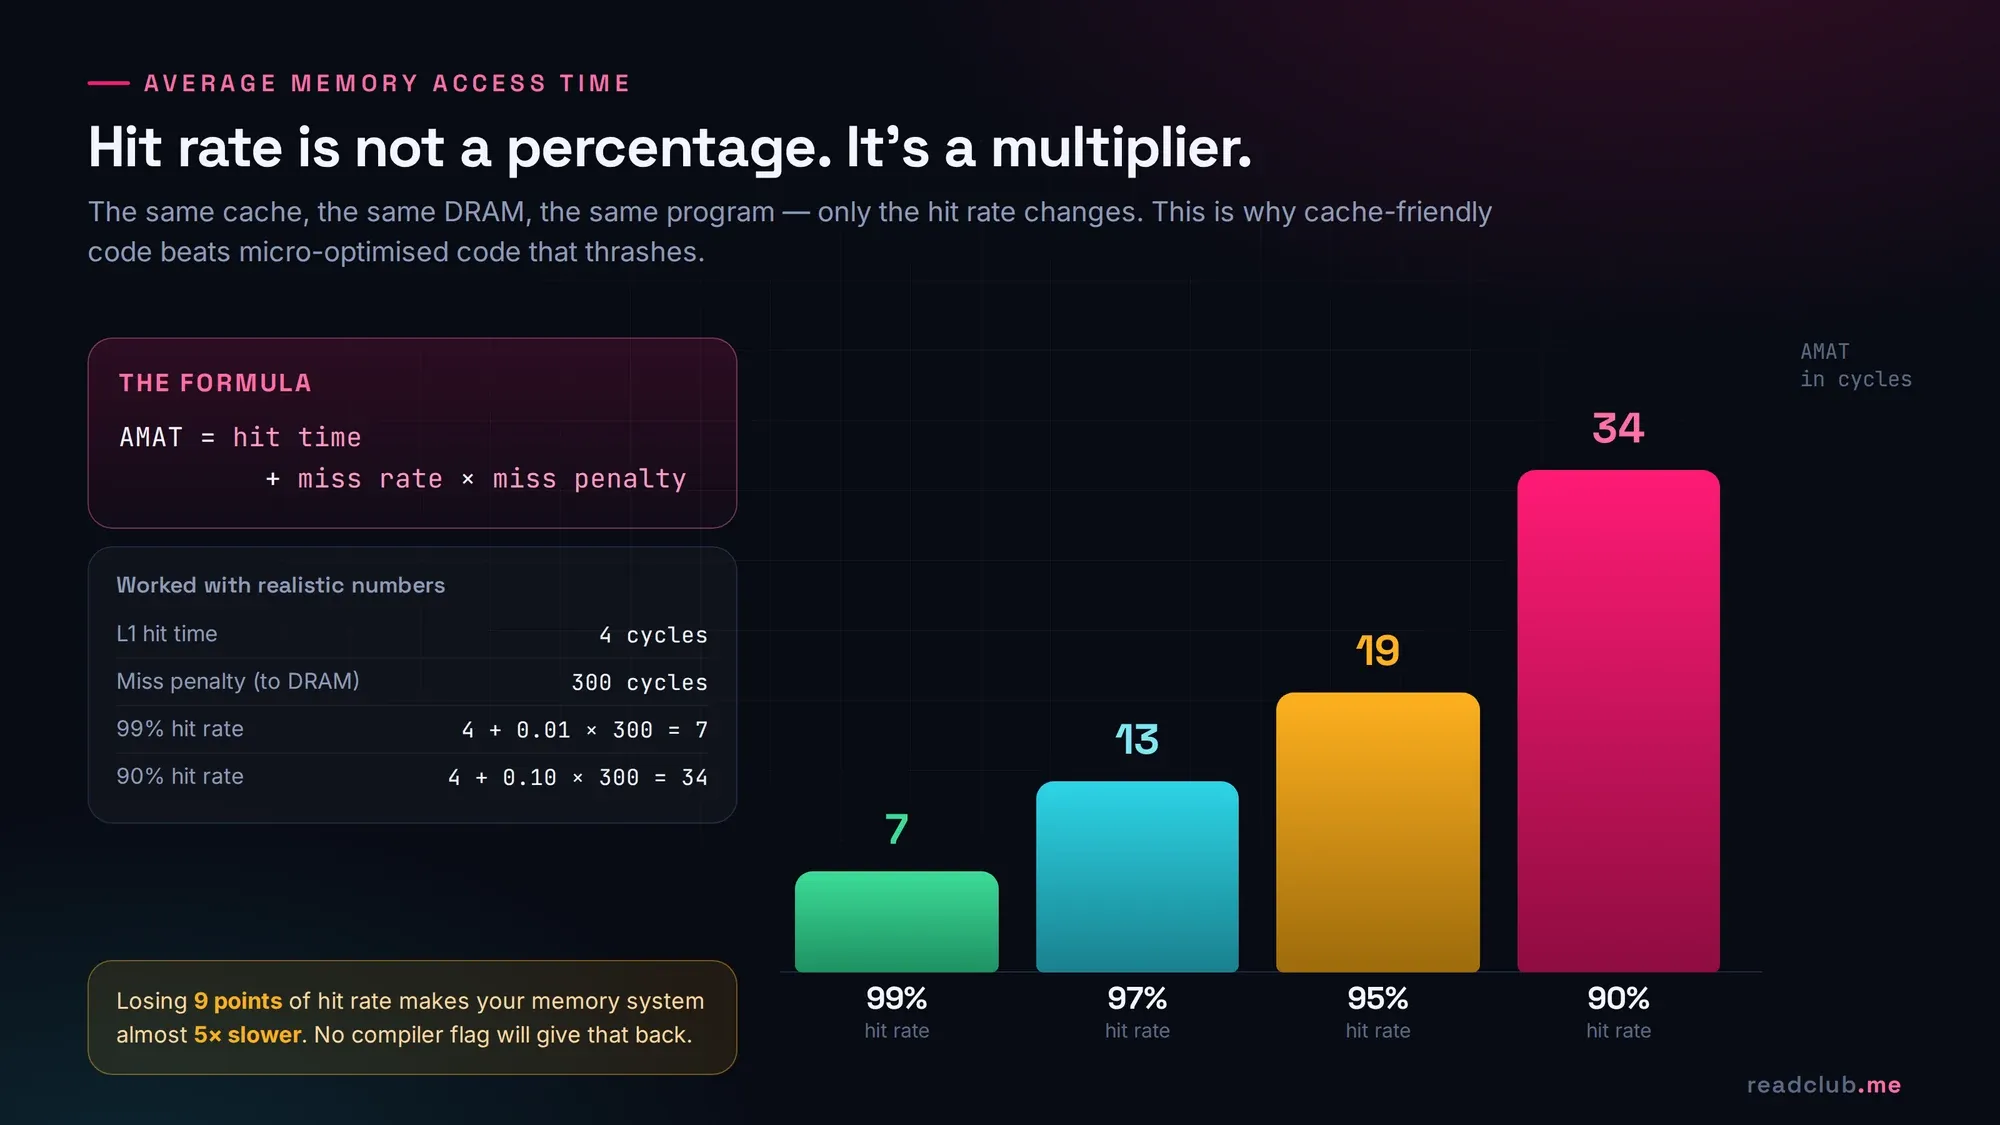
Take an L1 with a 4-cycle hit time and a 300-cycle penalty for going out to DRAM. At a 99% hit rate, AMAT is 7 cycles. At 90%, it is 34. The hit rate fell by nine percentage points; your memory system got almost five times slower. There is no compiler flag, no clock-speed bump and no extra core that recovers that.
This is also why the hierarchy has multiple levels. The miss penalty in the formula is not really "DRAM" — it is the AMAT of the next level down. Nest the formula and you can see exactly what an L2 or L3 is buying you: not more capacity for its own sake, but a cheaper penalty for the level above.
Once AMAT is in your hands, questions that used to feel arbitrary become mechanical. Is a bigger block size worth it? It lowers compulsory misses through spatial locality but raises the penalty and can cause pollution. Is a deeper hierarchy worth it? Compute both AMATs and see. This is one of those formulas that I make students derive rather than memorise, because once you can rebuild it you can adapt it to any hierarchy you are handed — including one with a 300-nanosecond hop across a network.
Why a stall costs more than you think
So far we have talked about one access in isolation. Now put it inside a pipeline, which is the other half of any COA course.
A five-stage pipeline overlaps fetch, decode, execute, memory and write-back so that ideally one instruction retires every cycle. A cache miss does not just delay the instruction that missed. It freezes everything behind it.
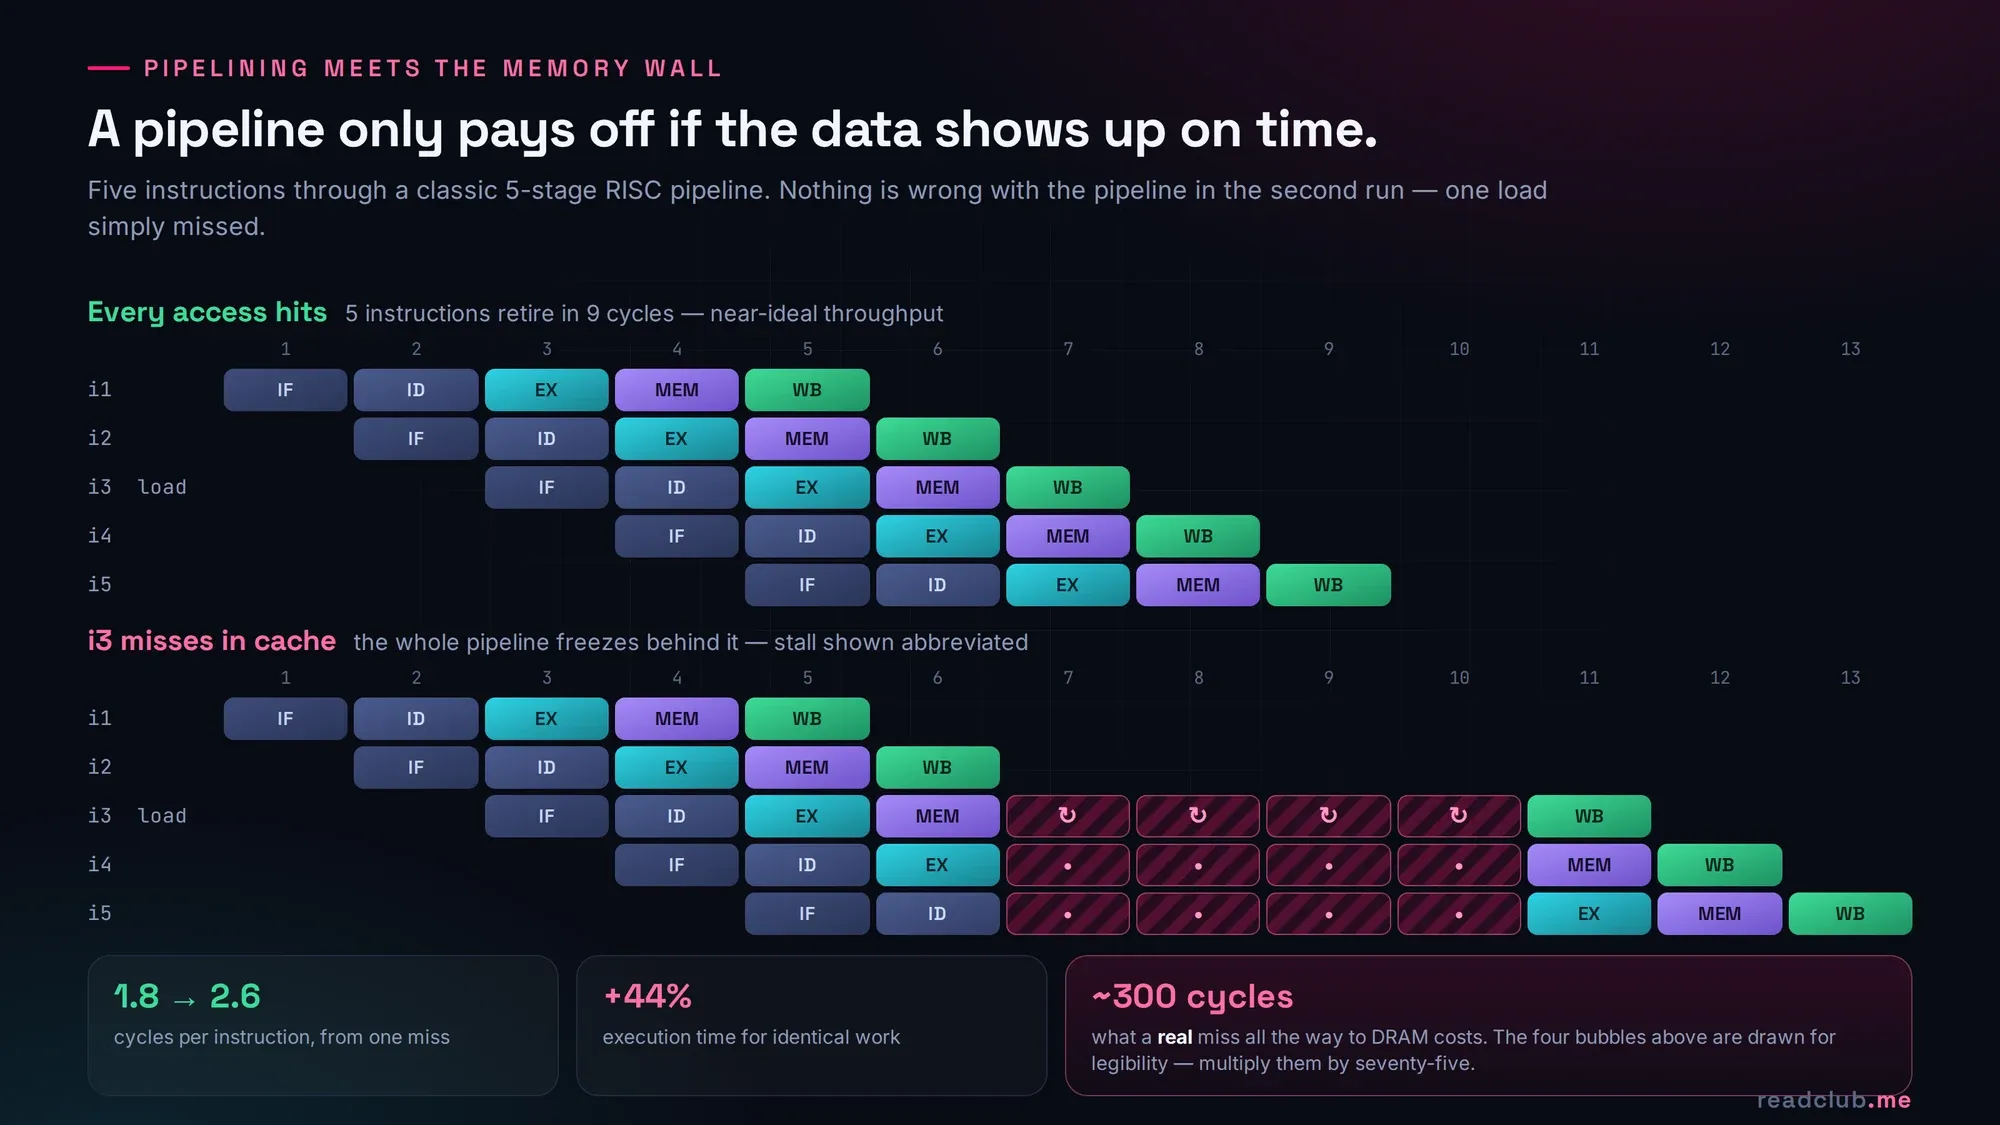
In the diagram above, one miss turns 9 cycles into 13 for the same five instructions. And that stall is drawn at four cycles purely so it fits on a page. A real miss to DRAM is around three hundred cycles — on a superscalar core capable of retiring four instructions per cycle, that is on the order of a thousand instruction slots evaporating because one pointer was not where the prefetcher expected it.
This is the moment where the two halves of the syllabus click together. Pipelining and CPI are not a separate topic from cache and memory organisation. CPI is:
CPI = CPI_ideal + (memory stalls per instruction)Which means the memory hierarchy is not a chapter in the performance story. Increasingly, it is the performance story. Out-of-order execution, hardware prefetchers, non-blocking caches and simultaneous multithreading all exist for one purpose: to find something useful to do during those three hundred cycles.
The roofline model: where your workload actually lives
Everything above is the undergraduate picture. Here is how a performance engineer expresses the same thing in one chart.
Arithmetic intensity is the number of floating-point operations a kernel performs per byte it moves from memory. Plot attainable performance against arithmetic intensity and you get two roofs: a sloped one set by memory bandwidth, and a flat one set by peak compute. Where they meet is the ridge point.
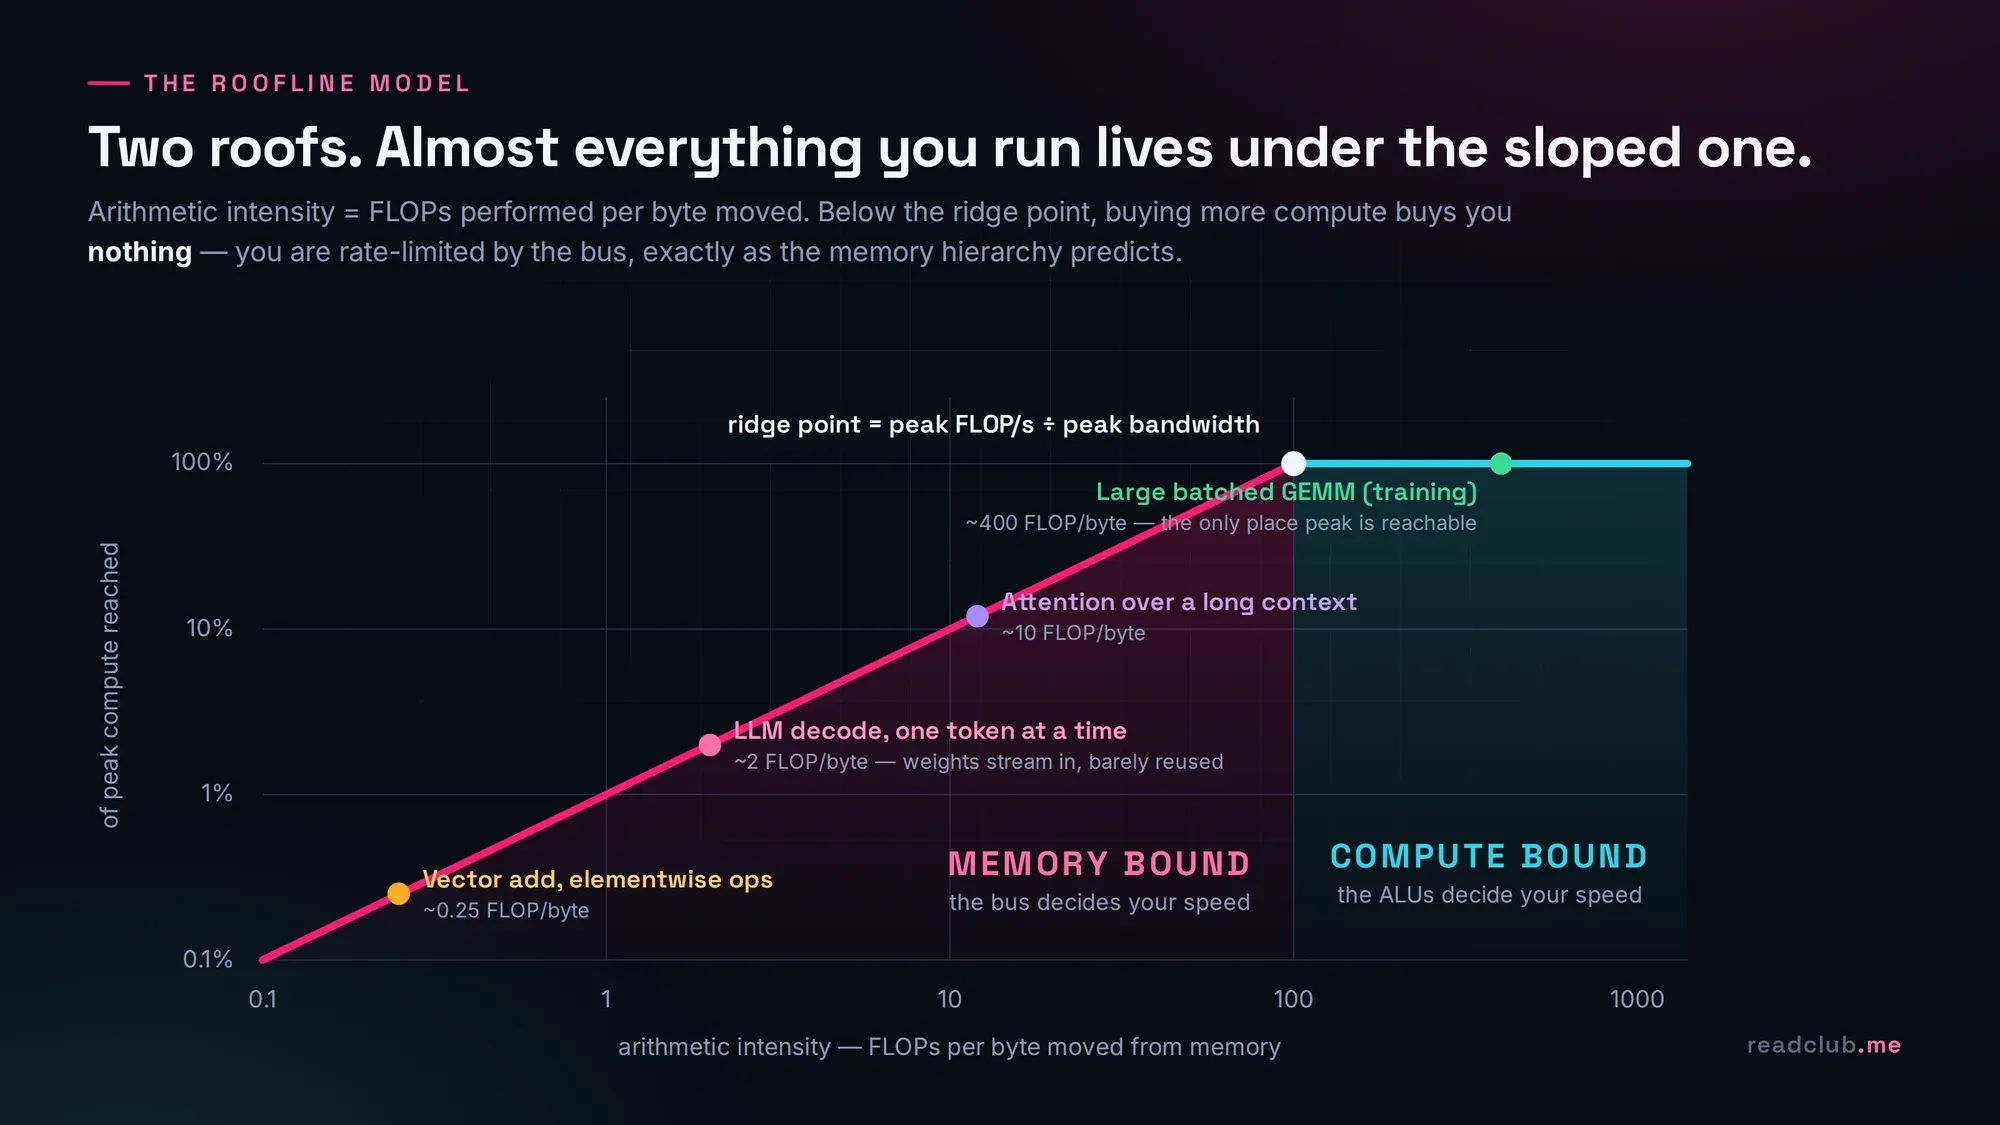
Read the chart and a lot of modern hardware news suddenly makes sense:
- Elementwise operations — adding two vectors, applying an activation — have an arithmetic intensity well under one. They are pinned to the sloped roof. A faster GPU does nothing for them.
- Generating one token at a time from a language model means streaming the entire weight matrix through the ALUs to do a single matrix-vector product. Intensity of roughly 2. Deeply memory-bound — which is precisely why inference latency tracks memory bandwidth rather than FLOPS, and why batching helps so dramatically.
- Large batched matrix multiplication reuses each loaded tile many times. Intensity in the hundreds. This is the only region where the advertised peak number is even theoretically reachable.
The roofline model is just the memory hierarchy, drawn as a chart, for people who have to sign purchase orders. And it explains a claim that circulated widely this year: measuring an accelerator by its TFLOPS is often measuring the wrong roof entirely.
Six defences architects are actually using
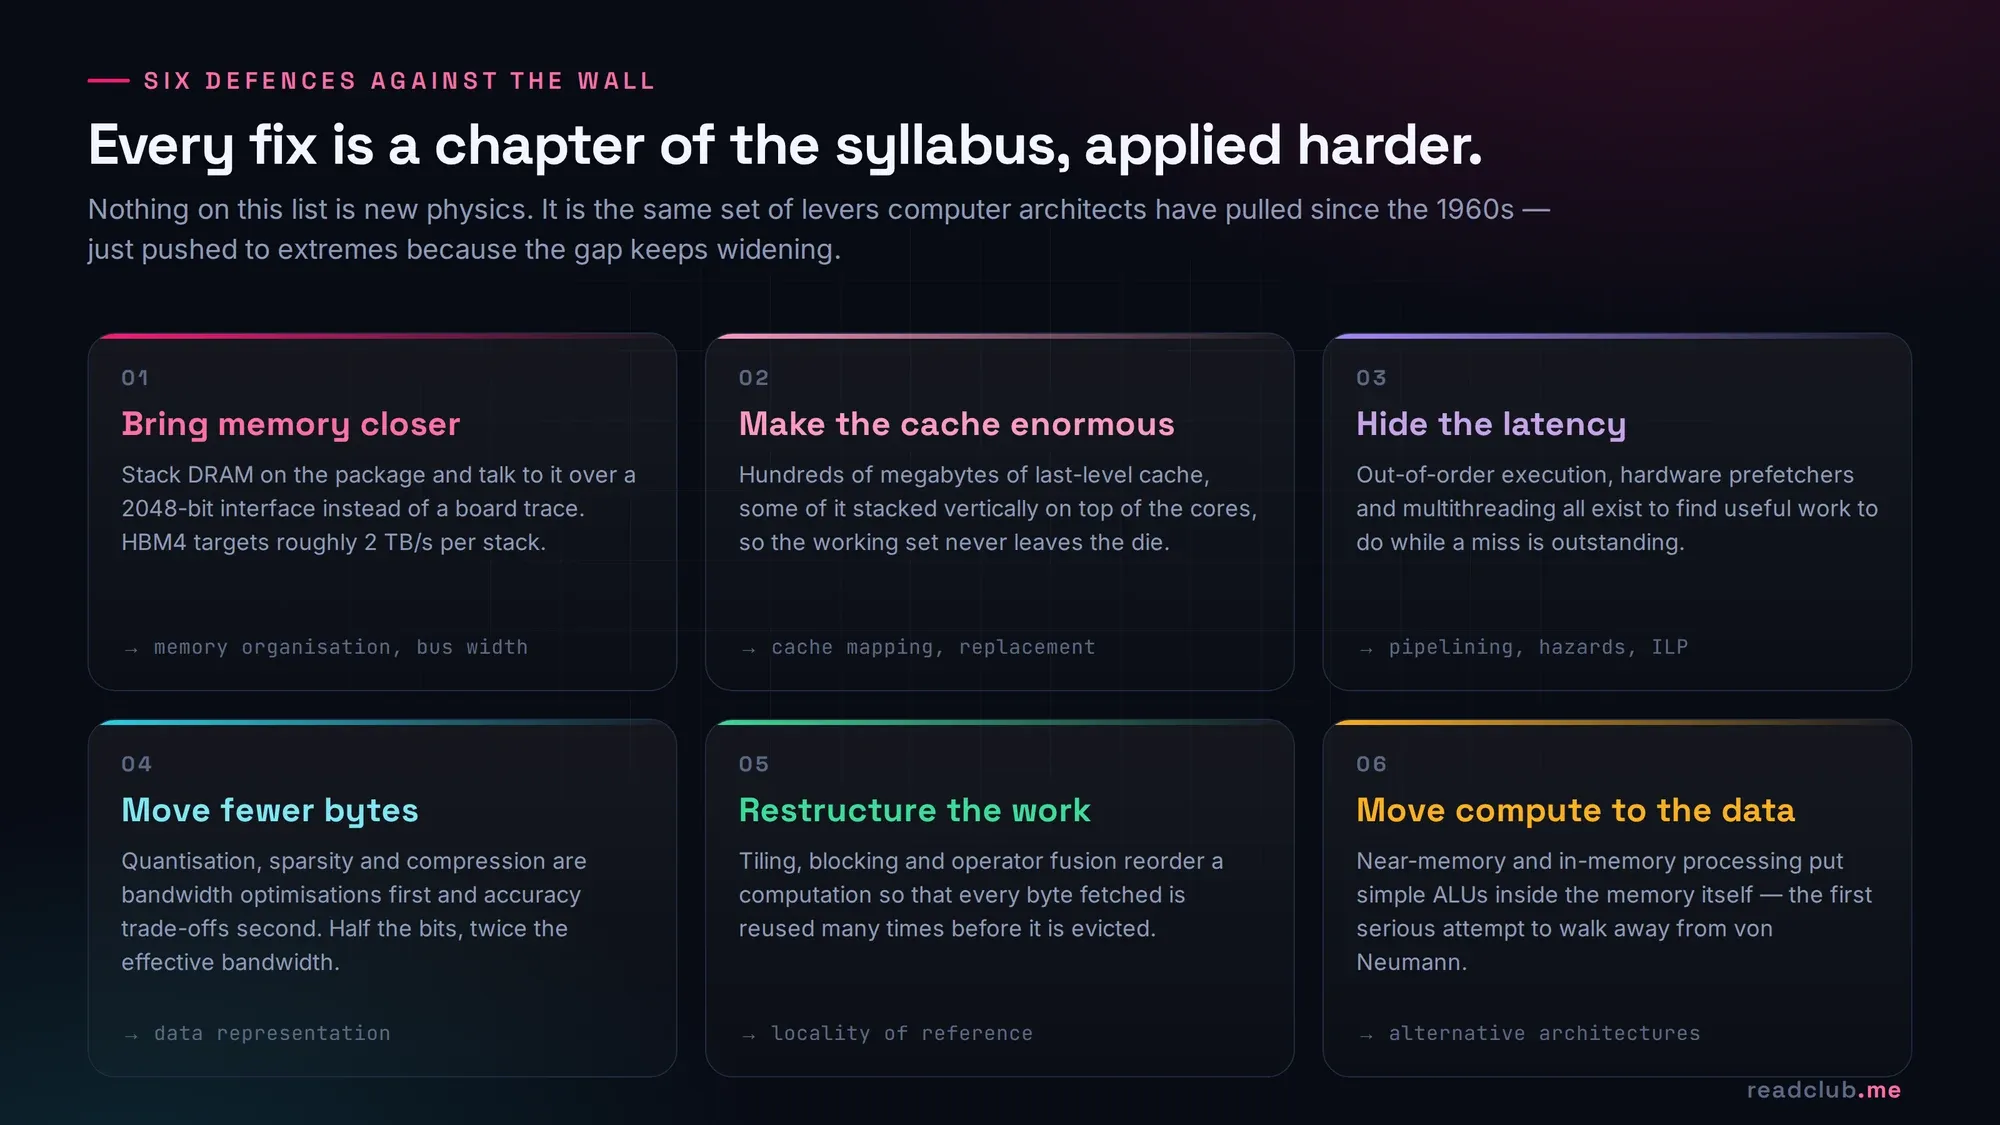
Notice what is not on that list: making the ALU faster. That lever has been pulled. Everything remaining is a memory-organisation problem — which is why the memory chapters of a COA course have quietly become the most valuable ones.
It is also why the industry story of the last two years is a memory story. HBM4 entering mass production with roughly 2 TB/s per stack. DRAM prices forecast to rise sharply through 2026 as manufacturers redirect capacity to server and high-bandwidth parts. Meta reporting that a meaningful share of unplanned interruptions during a large training run traced back to HBM failures. If you understand the hierarchy, none of those headlines are surprising. They are all the same headline.
Why this matters if you are studying this subject right now
I teach computer architecture, and the question I get most often is some version of: is this still relevant, or is it history?
I understand the instinct. Computer organization and architecture has a reputation as the dry paper — binary arithmetic, addressing modes, a lot of diagrams. It rarely gets the enthusiasm that a machine learning or web development course gets.
But look at what we just did. We started with a hardware headline from last week and explained it entirely with material from a second-year syllabus. Locality. Cache mapping. AMAT. Pipeline stalls. Arithmetic intensity is just the ratio of work done to bytes moved — a concept a student meets the first time they compare two nested loops.
The practical version of the argument is this: as more of the routine work in software gets automated, the durable skill is being the person who can explain why the system behaves the way it does. That person reads a flame graph and sees cache behaviour. That person looks at a $40,000 accelerator running at 8% utilisation and knows to check arithmetic intensity before ordering another one. That understanding comes from exactly one place, and it is not a framework tutorial. (I wrote more about that shift in this piece on AI and entry-level roles.)
If you want to see these principles in a real commercial design, the Apple M1 Ultra teardown is a good next read — unified memory and an enormous on-package bandwidth budget are a direct answer to everything above. And if you want to see how brutally hard the manufacturing side of this is, the ASML story is worth an hour.
If you want the full picture
Everything in this article — the fetch-decode-execute cycle, instruction set architecture, CPU benchmarking, pipelining and hazards, memory organisation and cache design, I/O and bus organisation — is what I teach in my Computer Architecture and Computer Organization Masterclass: 64 lectures, about 12.5 hours, with downloadable lecture notes and worked numericals of the kind used above. Around 17,000 students have taken it so far.
See the full curriculum on Udemy → (the link carries the current PROMO26 discount)
Frequently asked questions
What is the memory wall in computer architecture?
The memory wall is the growing gap between how fast processors can compute and how fast memory can supply data. Processor performance has historically improved much faster than DRAM latency and bandwidth, so an increasing share of execution time is spent waiting on memory rather than computing. In current AI hardware, compute is scaling roughly 3× every two years while memory bandwidth scales closer to 1.6–2×.
What is the difference between computer organization and computer architecture?
Computer architecture is the programmer-visible design — the instruction set, addressing modes, data types, registers: what the machine does. Computer organization is how that design is realised in hardware — the datapath, control unit, cache structure, bus widths and pipeline depth: how the machine does it. Two processors can share an architecture (so they run the same binaries) and have completely different organizations.
How do you calculate average memory access time?
AMAT = hit time + (miss rate × miss penalty). For a multi-level hierarchy the miss penalty of one level is the AMAT of the next level down, so the formula nests. With a 4-cycle hit time and a 300-cycle DRAM penalty, a 99% hit rate gives an AMAT of 7 cycles and a 90% hit rate gives 34.
Why is cache memory faster than main memory?
Two reasons. Cache is built from SRAM, which holds a bit in a latching circuit and can be read without the sense-and-refresh cycle that DRAM requires. And it is physically close to the core — often on the same die — so signals travel a much shorter distance. Both cost money and area, which is why caches are small and DRAM is large.
Is computer organization and architecture still worth studying in the age of AI?
It is arguably more relevant than it has been in twenty years. Modern AI performance is limited by memory bandwidth and data movement — precisely the material a COA course covers. Concepts like locality, cache mapping, AMAT and arithmetic intensity are what let you explain why an accelerator is running far below its advertised peak.
Which COA topics carry the most weight in exams?
Consistently: cache organization and mapping (including tag/index/offset field widths), average memory access time and hit-rate arithmetic, pipelining with hazards and speedup calculations, instruction set architecture and addressing modes, and performance equations such as CPU time = instruction count × CPI × clock cycle time. Those five carry most of the marks in most syllabuses.
Sources and further reading
- Gholami et al., AI and Memory Wall — the compute-versus-bandwidth scaling figures.
- TrendForce, Memory Wall Bottleneck: AI Compute Sparks Memory Supercycle — HBM4 bandwidth and 2026 DRAM pricing outlook.
- Micron at Hot Chips 2026, reported here — compute-versus-HBM scaling, stack heights, and the share of package silicon occupied by memory.
- Wulf & McKee, Hitting the Memory Wall: Implications of the Obvious (1994) — where the term comes from.
- Williams, Waterman & Patterson, Roofline: An Insightful Visual Performance Model (2009).
Dr Yasas Sri Wickramasinghe is a senior lecturer and researcher whose teaching includes computer architecture and systems. He writes at ReadClub.


